Our energy tools just got even better
You asked. We listened.
Thanks to your feedback, we are upgrading our energy management tools so you can take control of your energy costs and usage.
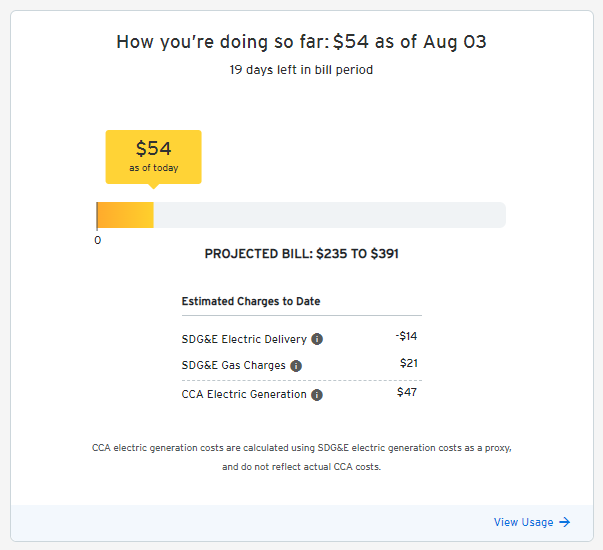
New “How you’re doing so far” tool
You told us that it’s important to have simple tools to manage your energy use and bill. That’s why we created the “How you’re doing so far” tool.
It gives you the power to manage your energy costs while avoiding surprises on your next bill, at-a-glance.
Here's how it works
- The gold indicator tracks how much you've spent so far, and the gray background represents your projected bill.
- There's also a breakdown of your estimated energy charges to date to help you better understand how your costs are related to your energy use.
- Updated daily, it's easy to track your upcoming bill at different times of the month.
For CCA customers, this tool gives you an estimate of your overall bill to date and projected bill where CCA electric generation costs are calculated using SDG&E electric generation costs as a proxy, and do not reflect actual CCA costs. Learn more about CCA
Make it work for you
Let’s say you're 10 days into your new billing cycle, and the indicator shows that your energy bill is projected to be high, maybe even higher than last month's. As a result, you decide to reduce your home's energy usage. Over the next several days you can use this tool to see how your changes affect your energy costs and upcoming bill.
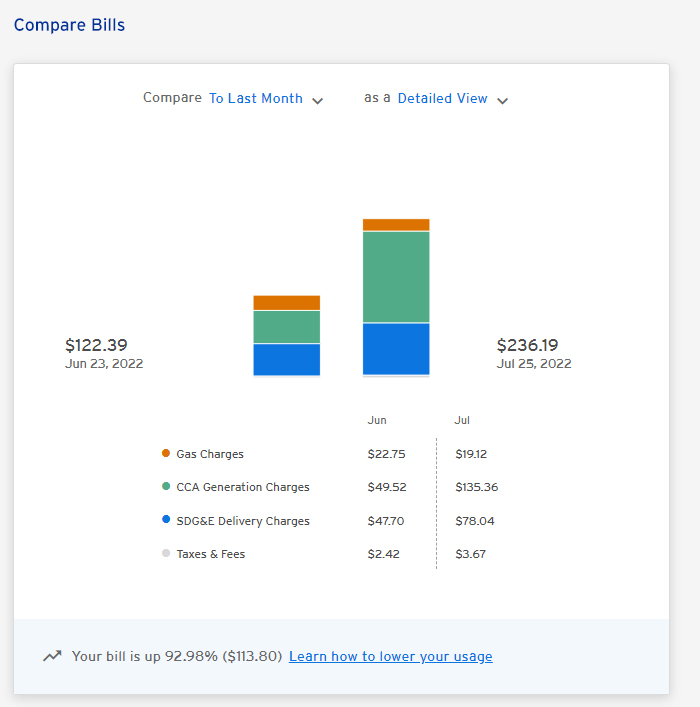
New Compare Bills Chart
We also added the Compare Bills chart to the My Account homepage. This simple yet powerful feature designed gives you a snapshot of your recent bill trends.
With it, you can make side-by-side comparisons of:
- Your last two months of energy bills
- Your last bill to the same month last year
At the bottom of the chart, there' s also a message to give you insight into whether your last bill was higher or lower by comparison.
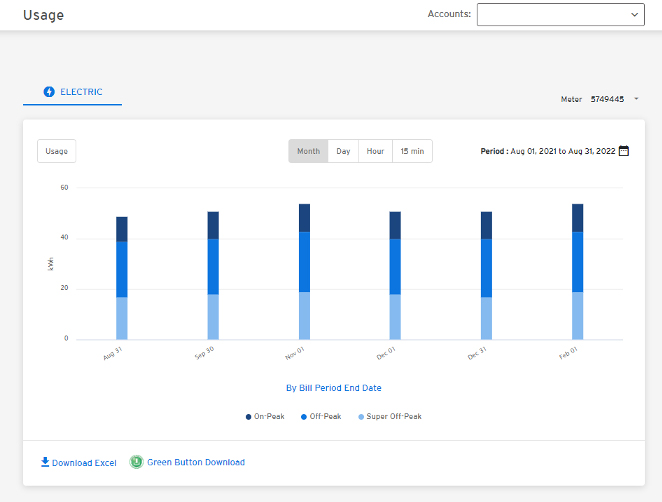
Improved Energy Usage Charts
You'll now find usage graphs to the top of the Usage page. No digging around.
Simply click the Usage tab from the main navigation.
- The first view is monthly usage with up to 13 months of historical usage data.
- For usage in your current bill cycle, click the Day and Hour buttons. These views are updated daily with usage data from the last 24 hours as well as historical data.
To simplify Usage, we also made two other changes:
- We moved the estimated bill to date and projected bill information to the My Account homepage where it's featured prominently in the new "How your doing so far" tool.
- And, we retired the Cost graph. Why? Because it didn't display the information you wanted - a historical view of total bill amounts. Instead, it displayed charges by meter and required extra work by you to calculate total amounts. To access your historical bill information, click the Billing tab and select Billing and Payment History.
Give these tools a test drive
Go to My Account and find out how these tools can help you manage your energy usage and expenses.